In lab 5, students used ArcGIS API for Javascript to create non-mobile platform applications. Using the skills developed in lab 5, students will construct mobile responsive Web GIS applications in this lab. Certain pieces of code need to be utilized that will allow the application to respond well on mobile platforms.
The main goal of this lab to is for students to build upon previously developed coding skills and to also teach students how to make Web GIS applications responsive on mobile platforms. Students will complete the following in this lab:
- Develop a search app that will allow users to search addresses, congressional districts, information about senators, and universities
- Develop a query app that will return graphical and text census information for Wisconsin counties
Methods
Part 1: Creating a Search Application
Section 1: Create a search app for addresses, congressional districts, and senator information
> The first step is to use Notepad++ to create an HTML document. An HTML tag must be inserted that will tell the browser to read from a left-to-right direction. The ESRI stylesheet must also be referenced. Next, for the app to be responsive on multiple platforms, the head tag should contain the following meta information: viewport for iOS devices and apple mobile web responsiveness, and chrome for Android. A title and references to the claro and ESRI style sheets should also be included. A style can now be written for the map that will fill the entire webpage and one for the search widget box. At this point, the document can be saved and closed out of for the moment.
> The next step is to use Notepad++ to create a JavaScript document. Import the map, search, FeatureLayer, and the InfoTemplate from the Dojo library and make the DOM (HTML page) ready. Create a function with four definition parameters that correspond to the four modules that were just imported. Next, create a map function and assign a new map object to this variable with properties for a basemap type, center, and zoom. Create an s variable and assign it a new search object with properties and their respective values for enableButtonMode, enableLabel, enableInfoWindow, showInfoWindowOnSelect, and map. Create a sources variable and assign it the results of the sources.push objects that will be created later. Create the first sources.push object that should have a feature layer property and an assigned property value of a congressional district service hosted by ArcGIS server. Define the object properties and their respective values next. After this, a similar sources.push object is created to use a service of U.S. senators names and locations. At this point the JavaScript file can be saved and closed out of.
> Reopen the HTML document that was just created. On a new line, reference the compact build of the ArcGIS API for JavaScript and the JavaScript file that was just created. Finally, create the container for the map and the search widget, and create a <div> element for the search widget box and one to hold the map. Close the <body> and <html> and save and close the document.
> The HTML and part of the JavaScript coding for this section can be seen below (Figures 1 and 2).
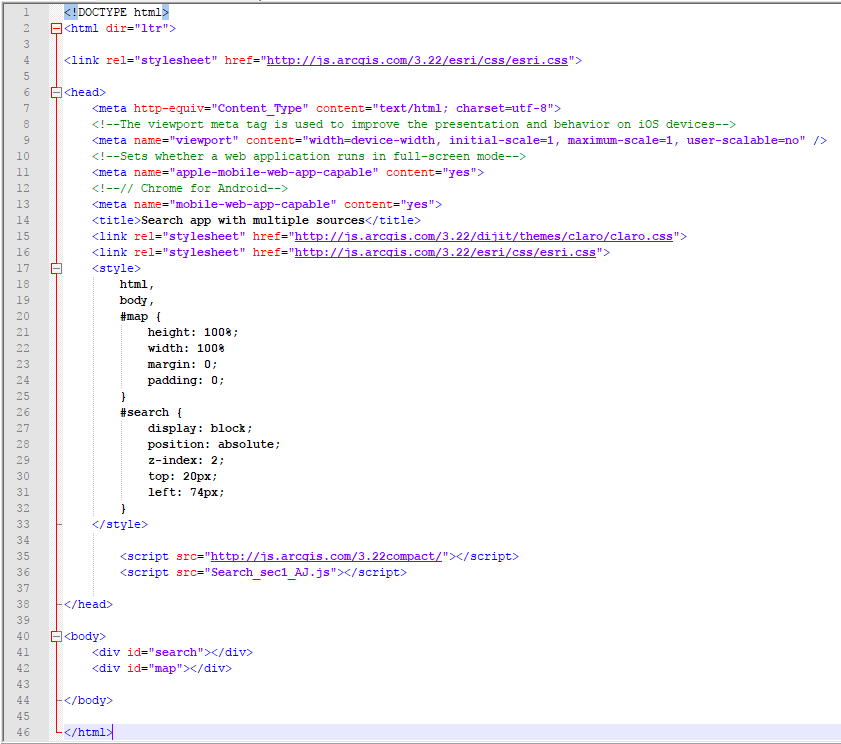 |
| Figure 1: Resulting HTML code from part 1 section 1 |
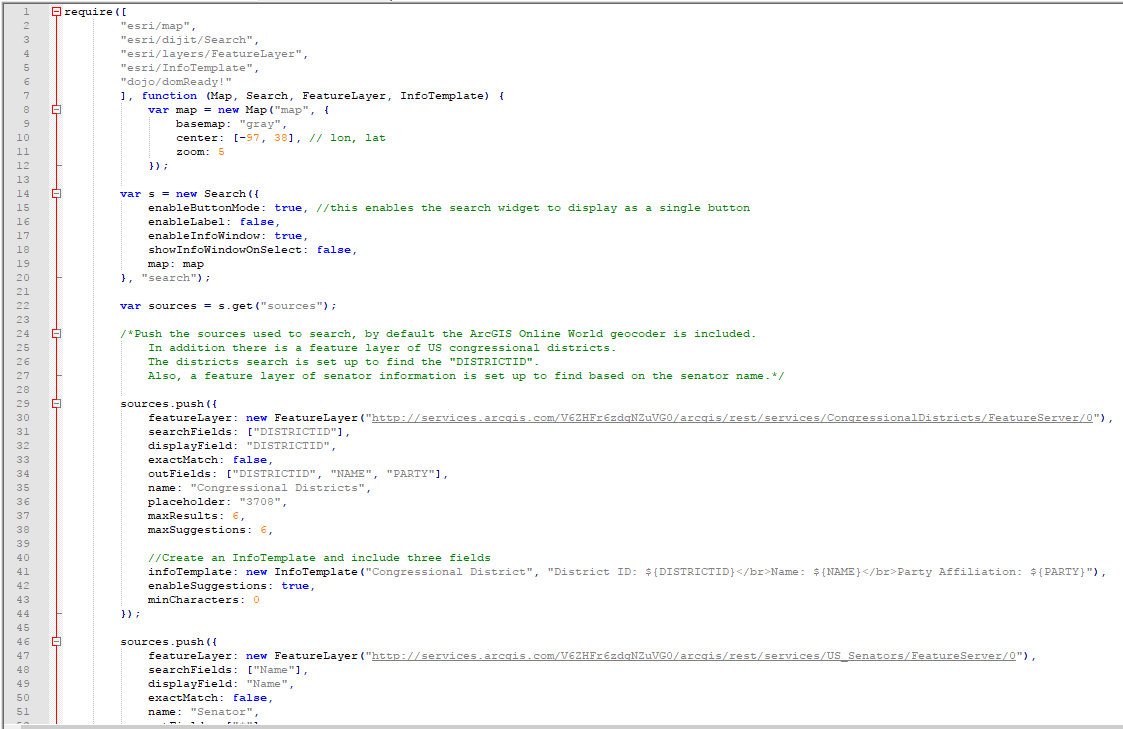 |
| Figure 2: Part of the resulting JavaScript code from part 1 section 1 |
> The same search app code will be used in this section. However, students will replace the senator service with a universities service that students will create first before utilizing. Using a feature class of U.S. Universities, students will publish a universities feature service to the UWEC Geography ArcGIS REST Server and configure the relevant search fields so that users can search for a university and its location along with other information.
> First, students must connect their enterprise geodatabase in ArcMap and import the universities feature class into that geodatabase. From there this feature class can be added to the map and then published to the REST Server in each students' personal folders.
> Copy and paste the HTML and JavaScript documents from section 1 and rename them. Open the JavaScript document and remove the senators feature service URL and replace it with the universities URL. Change the property values to accordingly and adjust the infoTemplate values to reflect the relevant fields of the universities feature service. Save the document and close it.
> Open the renamed HTML document and reference the renamed JavaScript document. Save and close the document. The replaced JavaScript coding for this section can be seen below (Figure 3).
 |
| Figure 3: The universities JavaScript code that replaced the senators code in part 1 section 2 |
> In this part of the lab, students create a simple mobile responsive query app that will allow users to see how each Wisconsin county's population compares to the highest populated county in the state.
> Using Notepad++, create an HTML document and start by entering the relevant meta information and external stylesheets. The document and be saved and closed for the moment. The body will be coded later.
> Using a new Notepad++ document, the JavaScript will be developed. Import the required modules from the Dojo library and DojoX sub-library which is used to add additional functionality to the display of the query result. Create an app variable and assign it a null {} value. The value of the null object is obtained from a service of demographic information for the U.S. which will take advantage of the Wisconsin component of the service. Next, create a countiesUrl variable and assign the aforementioned service to it. Create a stateList variable and additional variables for the query definition, fields that records will be extracted from, and so on. Create an hColor variable and assign it a hexadecimal color, and create an hOutline variable and assign it a simple line symbol class.
> The query task must now be initialized. Create a popQueryTask and assign it the value of the ESRI service previously referenced. Also create popQuery and statDef variables, and configure three query stat definitions that will return end-user desired records. Next, develop the query filter for string, number, and geometry and call the execute method for the query. Create a layer to show the query result and declare an object that will create the resulting graphic layer.
> Set a definition expression so that only Wisconsin counties will be displayed. Create the analog gauge and declare a function called showInfo with an event definition parameter and arguments that will display the graphics and gauge. Following this, a function is declared to create the gauge and an object is created that will give a physical configuration and operational functionality to the gauge. Continue to design the gauge and write an expression to position the gauge within the app where it will not obstruct the Wisconsin graphic.
> The JavaScript file can be saved and closed. Styling for the map will now be developed for the map, text, gauge result, county result, and the margin for the webpage in a CSS file.
> Return to the HTML document and reference the JavaScript and CSS files that were just created. Next, the code for the body of the HTML page will be written which will determine how the query app will be displayed on the webpage. Save and close the document.
> The coding for the HTML, CSS, and part of the JavaScript documents can be viewed below (Figures 4-8).
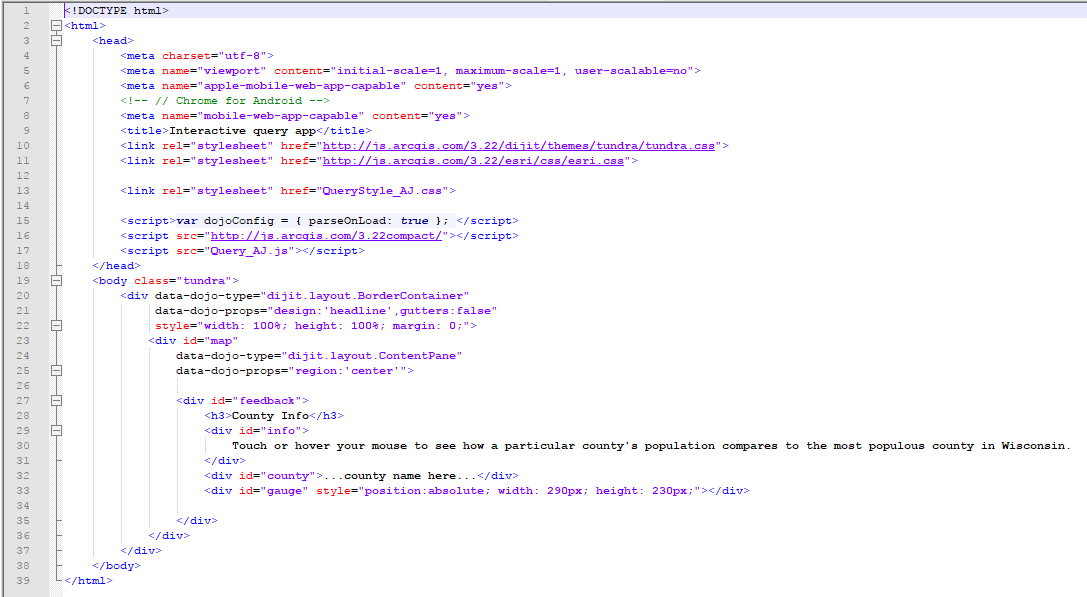 |
| Figure 4: Resulting HTML code in part 2 |
 |
| Figure 5: Resulting CSS code in part 2 |
 |
| Figure 6: Top section of resulting JavaScript code in part 2 |
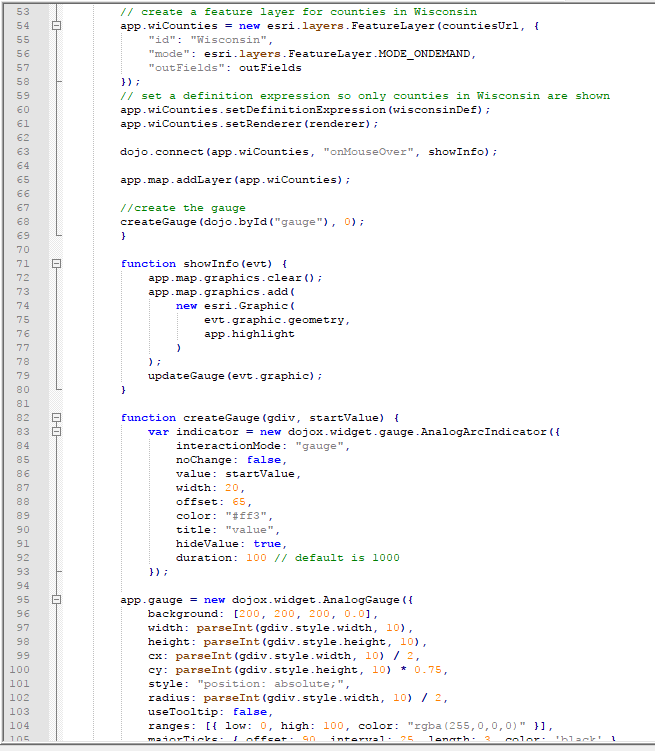 |
| Figure 7: Middle section of resulting JavaScript code in part 2 |
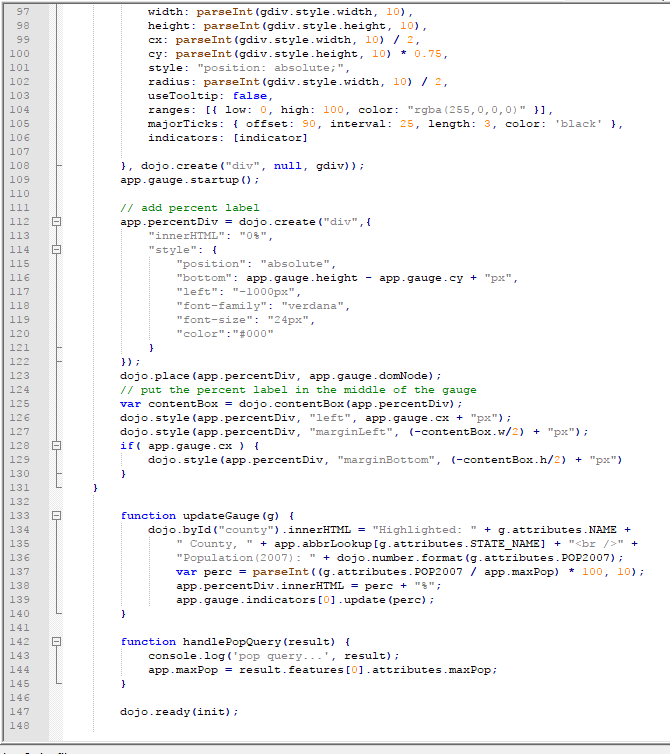 |
| Figure 8: Bottom section of resulting JavaScript code in part 2 |
The resulting app from section 1 of part 1 can be seen below (Figure 9). End users can pan and zoom in and out, but more importantly, they can search for an address, congressional district, and/or senator. When either of these search options is selected, the end user enters the appropriate search into the search box, and when a result is returned, it zooms into that geographic location.
 |
| Figure 9: Screenshot of the result from section 1 part 1 |
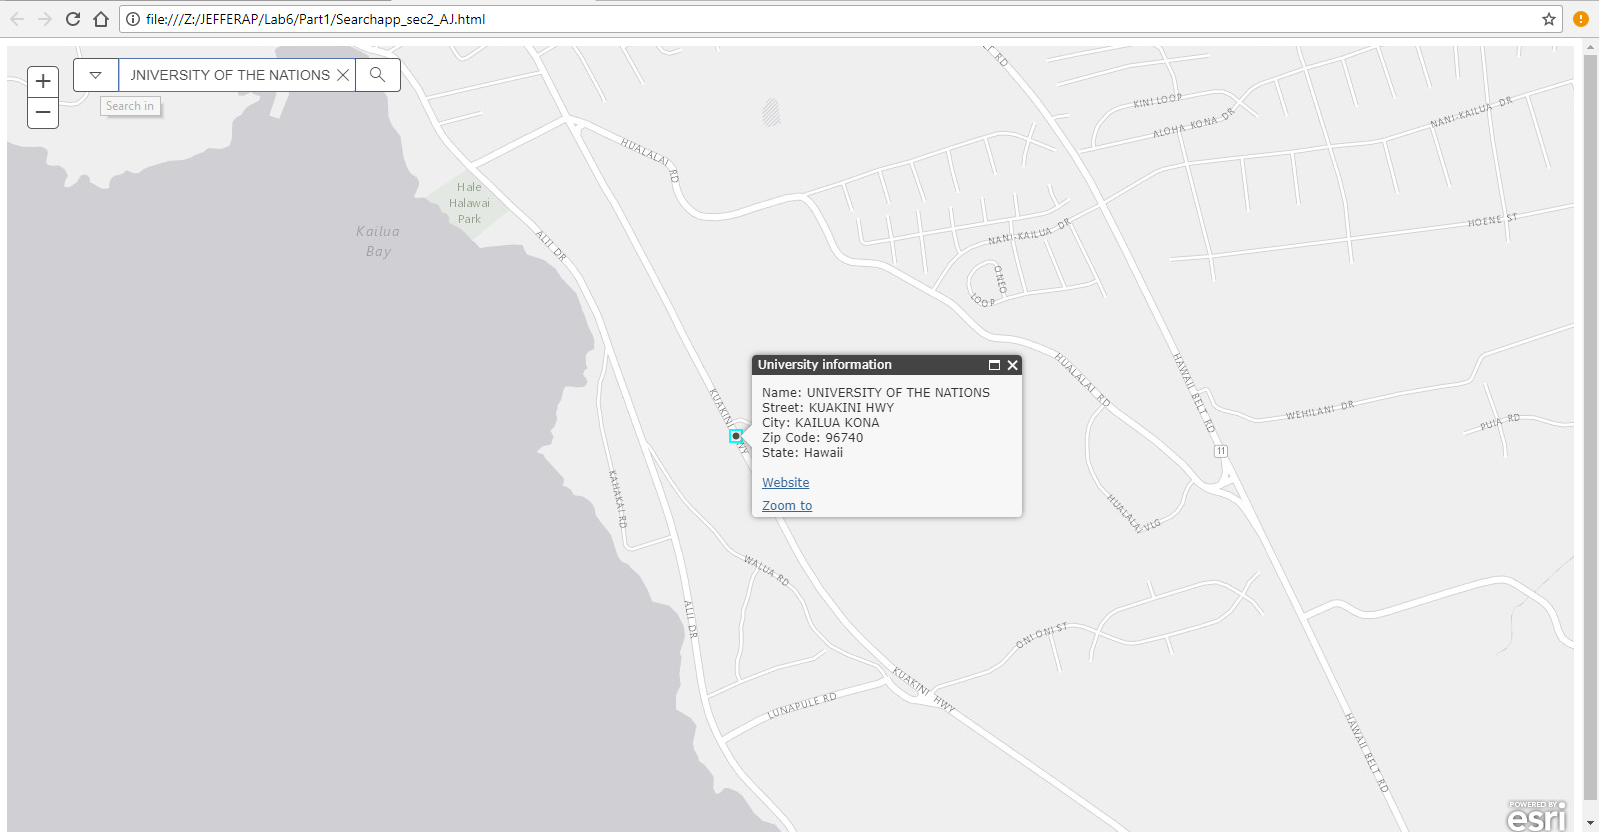 |
| Figure 10: Screenshot of the result from section 2 part 1 |

Sources
University feature class:
Esri Demographics. (n.d.). Retrieved November 15, 2017, from http://doc.arcgis.com/en/esri-demographics/data/business.htm
CongressionalDistricts (Feature Server):
ArcGIS REST Services
US_Senators (FeatureServer):
ArcGIS REST Services
ArcGIS REST Services
Census (MapServer):
Bureau, U. C. (n.d.). Census.gov. Retrieved November 15, 2017, from http://www.census.gov/
Bureau, U. C. (n.d.). Census.gov. Retrieved November 15, 2017, from http://www.census.gov/
No comments:
Post a Comment