Monday, November 27, 2017

Web GIS Lab 7: Volunteered Geographic Information (VGI)

Goal and Background

Volunteered geographic information (VGI) allows the general public to voluntarily provide geographic data by giving them access to tools that allows them to generate this data. Instead of hiring individuals to collect data, a web GIS application can be developed that will allow the public to collect information by their own free will. This is referred to as user-generated content. It is a useful method for collecting various types of data which may not have been collected by only a few hired individuals.

In this lab, students will develop a web GIS application which will allow the public to collect geographic data and upload it to the application. Students will complete the following tasks:

  1. Author a map document to support feature services and web editing
  2. Prepare an enterprise geodatabase feature template for publishing
  3. Consume the feature service in a web GIS app


Methods

Part 1: Author a Map Document to Support Feature Services and Web Editing

Section 1: Create attribute domains and subtypes

Domains and subtypes are created for the fire hydrant (point), sidewalk (line), and green space (polygon) features that will be collected through the VGI app. This process will be completed in ArcMap. Students must first connect to their personal enterprise geodatabase on the ArcGIS server. in the database properties, domains can be created

Section 2: Create feature templates for VGI attributes to be collected

Section 3: Create feature attachments, define layer renderer and symbology

Section 4: Add features to the map document

Part 2: Prepare Your Enterprise Geodatabase Feature Template for Publishing

Section 1: Prepare the map document and connect to ArcGIS server publisher

Section 2: Publish a map service with feature access enabled

Part 3: Consuming the Feature Service in a Web GIS Application

Section 1: Develop a user interface for VGI data collection

Section 2: Fine tune the template picker to be responsive in smart phones

Results

Part 1

Part 2

Part 3

Sources

Wednesday, November 15, 2017

Web GIS Lab 6: ArcGIS API for JavaScript 2: Mobile Responsive Apps

Goal and Background

In lab 5, students used ArcGIS API for Javascript to create non-mobile platform applications. Using the skills developed in lab 5, students will construct mobile responsive Web GIS applications in this lab. Certain pieces of code need to be utilized that will allow the application to respond well on mobile platforms.

The main goal of this lab to is for students to build upon previously developed coding skills and to also teach students how to make Web GIS applications responsive on mobile platforms. Students will complete the following in this lab:

  1. Develop a search app that will allow users to search addresses, congressional districts, information about senators, and universities
  2. Develop a query app that will return graphical and text census information for Wisconsin counties

Methods

Part 1: Creating a Search Application

Section 1: Create a search app for addresses, congressional districts, and senator information

> The first step is to use Notepad++ to create an HTML document. An HTML tag must be inserted that will tell the browser to read from a left-to-right direction. The ESRI stylesheet must also be referenced. Next, for the app to be responsive on multiple platforms, the head tag should contain the following meta information: viewport for iOS devices and apple mobile web responsiveness, and chrome for Android. A title and references to the claro and ESRI style sheets should also be included. A style can now be written for the map that will fill the entire webpage and one for the search widget box. At this point, the document can be saved and closed out of for the moment.

>  The next step is to use Notepad++ to create a JavaScript document. Import the map, search, FeatureLayer, and the InfoTemplate from the Dojo library and make the DOM (HTML page) ready. Create a function with four definition parameters that correspond to the four modules that were just imported. Next, create a map function and assign a new map object to this variable with properties for a basemap type, center, and zoom. Create an s variable and assign it a new search object with properties and their respective values for enableButtonMode, enableLabel, enableInfoWindow, showInfoWindowOnSelect, and map. Create a sources variable and assign it the results of the sources.push objects that will be created later. Create the first sources.push object that should have a feature layer property and an assigned property value of a congressional district service hosted by ArcGIS server. Define the object properties and their respective values next. After this, a similar sources.push object is created to use a service of U.S. senators names and locations. At this point the JavaScript file can be saved and closed out of.

> Reopen the HTML document that was just created. On a new line, reference the compact build of the ArcGIS API for JavaScript and the JavaScript file that was just created. Finally, create the container for the map and the search widget, and create a <div> element for the search widget box and one to hold the map. Close the <body> and <html> and save and close the document.

> The HTML and part of the JavaScript coding for this section can be seen below (Figures 1 and 2).

Figure 1: Resulting HTML code from part 1 section 1

Figure 2: Part of the resulting JavaScript code from part 1 section 1
Section 2: Modifying the search app to reference a different service

> The same search app code will be used in this section. However, students will replace the senator service with a universities service that students will create first before utilizing. Using a feature class of U.S. Universities, students will publish a universities feature service to the UWEC Geography ArcGIS REST Server and configure the relevant search fields so that users can search for a university and its location along with other information.

> First, students must connect their enterprise geodatabase in ArcMap and import the universities feature class into that geodatabase. From there this feature class can be added to the map and then published to the REST Server in each students' personal folders.

> Copy and paste the HTML and JavaScript documents from section 1 and rename them. Open the JavaScript document and remove the senators feature service URL and replace it with the universities URL. Change the property values to accordingly and adjust the infoTemplate values to reflect the relevant fields of the universities feature service. Save the document and close it.

> Open the renamed HTML document and reference the renamed JavaScript document. Save and close the document. The replaced JavaScript coding for this section can be seen below (Figure 3).

Figure 3: The universities JavaScript code that replaced the senators code in part 1 section 2
Part 2: Creating a Query Application

> In this part of the lab, students create a simple mobile responsive query app that will allow users to see how each Wisconsin county's population compares to the highest populated county in the state.

> Using Notepad++, create an HTML document and start by entering the relevant meta information and external stylesheets. The document and be saved and closed for the moment. The body will be coded later.

> Using a new Notepad++ document, the JavaScript will be developed. Import the required modules from the Dojo library and DojoX sub-library which is used to add additional functionality to the display of the query result. Create an app variable and assign it a null {} value. The value of the null object is obtained from a service of demographic information for the U.S. which will take advantage of the Wisconsin component of the service. Next, create a countiesUrl variable and assign the aforementioned service to it. Create a stateList variable and additional variables for the query definition, fields that records will be extracted from, and so on. Create an hColor variable and assign it a hexadecimal color, and create an hOutline variable and assign it a simple line symbol class.

> The query task must now be initialized. Create a popQueryTask and assign it the value of the ESRI service previously referenced. Also create popQuery and statDef variables, and configure three query stat definitions that will return end-user desired records. Next, develop the query filter for string, number, and geometry and call the execute method for the query. Create a layer to show the query result and declare an object that will create the resulting graphic layer.

> Set a definition expression so that only Wisconsin counties will be displayed. Create the analog gauge and declare a function called showInfo with an event definition parameter and arguments that will display the graphics and gauge. Following this, a function is declared to create the gauge and an object is created that will give a physical configuration and operational functionality to the gauge. Continue to design the gauge and write an expression to position the gauge within the app where it will not obstruct the Wisconsin graphic.

> The JavaScript file can be saved and closed. Styling for the map will now be developed for the map, text, gauge result, county result, and the margin for the webpage in a CSS file.

> Return to the HTML document and reference the JavaScript and CSS files that were just created. Next, the code for the body of the HTML page will be written which will determine how the query app will be displayed on the webpage. Save and close the document.

> The coding for the HTML, CSS, and part of the JavaScript documents can be viewed below (Figures 4-8).

Figure 4: Resulting HTML code in part 2
Figure 5: Resulting CSS code in part 2
Figure 6: Top section of resulting JavaScript code in part 2
Figure 7: Middle section of resulting JavaScript code in part 2
Figure 8: Bottom section of resulting JavaScript code in part 2
Results

The resulting app from section 1 of part 1 can be seen below (Figure 9). End users can pan and zoom in and out, but more importantly, they can search for an address, congressional district, and/or senator. When either of these search options is selected, the end user enters the appropriate search into the search box, and when a result is returned, it zooms into that geographic location.

Figure 9: Screenshot of the result from section 1 part 1
The resulting app from section 2 of part 1 can be seen below (Figure 10). The functionality of this app is exactly the same as in section 1. However, instead of senators, end-users can now search for universities within the U.S. where once a university name is entered, it will take the user to that location and display the university's name, street, city, zip code, and state.

Figure 10: Screenshot of the result from section 2 part 1
The resulting app from part 2 can be seen below (Figure 11). The app opens up to the extent of Wisconsin where Wisconsin counties are overlaid on a basemap. End-users can pan around the map and zoom in and out. More importantly, users can hover the mouse pointer over any county, and that county's border will be highlighted yellow and will display the county's name and population (2007). Also, below this information, a gauge displays that particular county's population as a percentage to the most populated county in Wisconsin (which is Milwaukee county at around 927,000 people).


Sources

University feature class:
Esri Demographics. (n.d.). Retrieved November 15, 2017, from http://doc.arcgis.com/en/esri-demographics/data/business.htm

CongressionalDistricts (Feature Server): 
ArcGIS REST Services

US_Senators (FeatureServer):
ArcGIS REST Services

Census (MapServer):
Bureau, U. C. (n.d.). Census.gov. Retrieved November 15, 2017, from http://www.census.gov/  

Wednesday, November 8, 2017

Web GIS Lab 5: ArcGIS API for JavaScript 1

Goal and Background

ArcGIS API for JavaScript allows for the creation of high-performing web mapping applications that includes information such as terrain, basemaps, imagery, and features. The API makes it simple for end users to access the full range of capabilities available in the ArcGIS platform. The apps can be used on both mobile devices or desktops.

The goal of this lab is for students to how to use the ArcGIS JavaScript API to incorporate GIS services into a website. At the end of the lab, students will be more familiar with writing JavaScript codes in developing applications, especially using the JavaScript API for creating Web GIS applications.

In this lab, students will complete the following:
  1. Create a basic Web GIS mapping app
  2. Build a Web GIS app with operational layer functionality
  3. Fine tune an application popup window and add a scale bar
Methods

Part 1: Create a Basic Web GIS Mapping App

In this part, students will:

     > Set up a basic HTML and JavaScript document
     > Reference the ArcGIS API for JavaScript in the HTML document
     > Use a streets basemap from ArcGIS Online
     > Specify the map scale and center point
     > Display the map full screen

Students must create a Lab5 folder in their personal folders in the development server where all work will be saved. Using Notepad++, both an HTML document and a JavaScript document will be created.

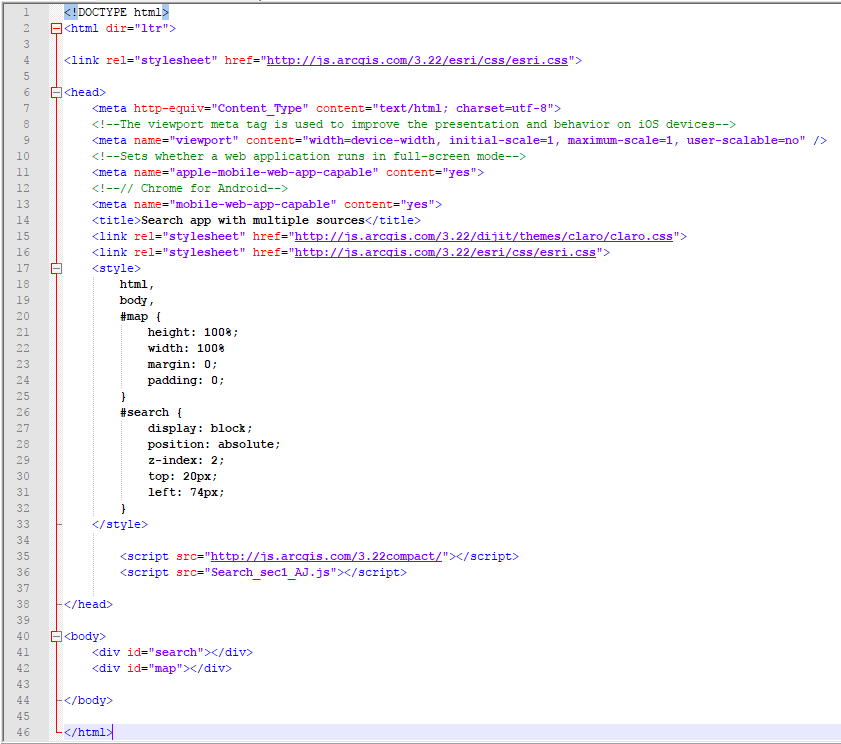
In the HTML document, an external CSS style sheet (claro) and ESRI's style sheet for web maps is referenced. The claro theme is a style sheet for the display of web GIS applications while ESRI's style sheet is used to style feature on a web map. The latest 2D version of ArcGIS API for JavaScript is also referenced.

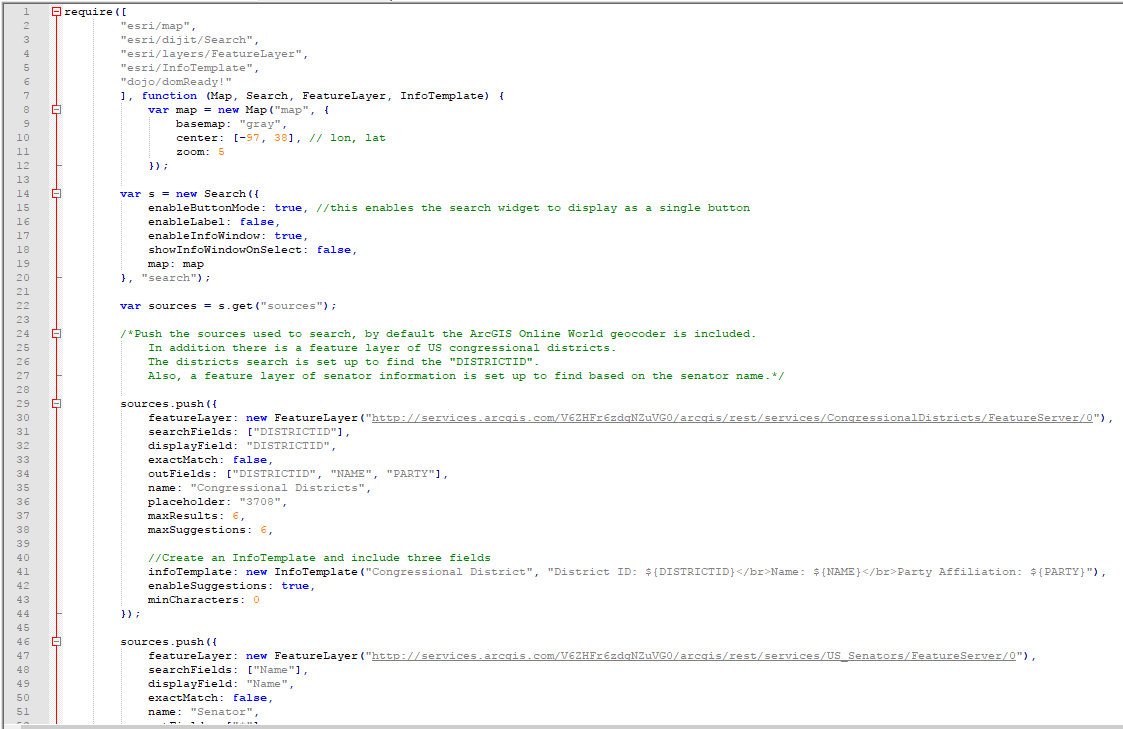
After the code is entered into the HTML document, the JavaScript code will now be written which will implement the Web GIS app. Connection to the Dojo library must be made first to import and access modules for the map. Next, the center coordinate, zoom level, and streets basemap map type is setup for a new map object.

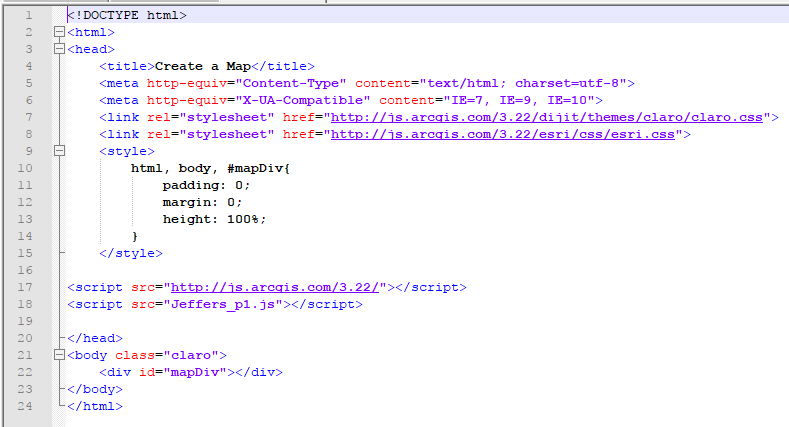
Once the JavaScript document is created and saved, it must be referenced in the HTML document. The code for both documents can be viewed below (Figures 1 and 2).

Figure 1: Part 1 HTML code

Figure 2: Part 1 JavaScript code

Part 2: Build a Web GIS App with Operational Layer Functionality

Section 1: Develop JavaScript Methods to Display Tree Species and Attributes

Students will create an app that displays tree species and their attributes for the city of San Francisco. To create this app, an HTML document will host the app, JavaScript methods will be developed to display the feature service attributes, and an internal CSS and JavaScript file will be used.

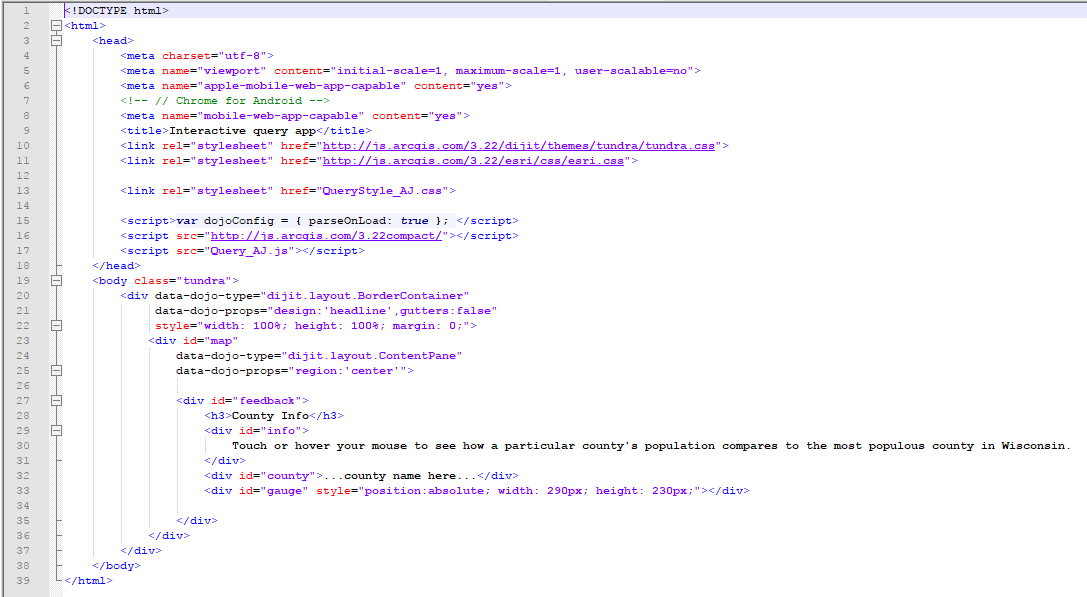
Using Notepad++, an HTML document is created to define the web page of the app. An external stylesheet from ArcGIS and the InfoWindow.css file (provided to students) are both linked. After this, enter the code to link the CSS styling sheets. Next, the styling properties for the map are coded.

After the HTML document, a new Notepad++ document is used to write the JavaScript code. Enter the 'require' command to access modules for dojo DOMs, dojo string, myModules, and some ESRI utilities. A new Map object is created with various properties, and a new InfoTemplate is coded to display the popup content of a feature in the app. Declare a 'featureLayer' variable that will reference a feature service of streets in San Francisco.

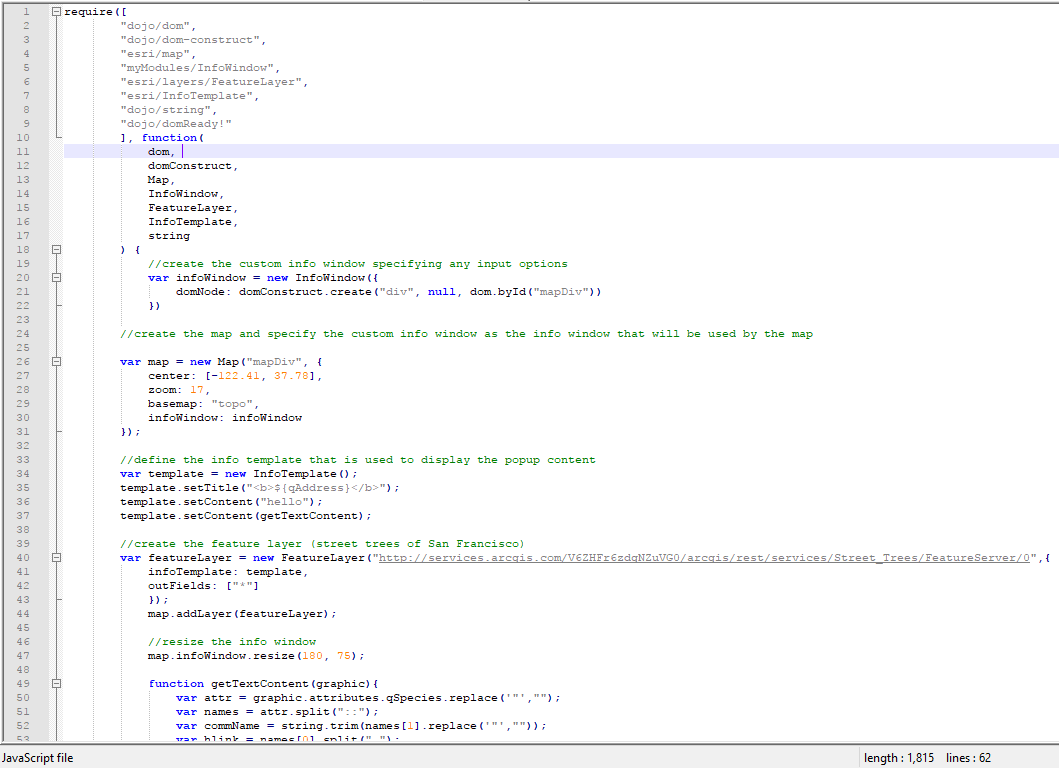
After the JavaScript file is written and saved, it must be referenced in the HTML document that was just created. The ArcGIS API for JavaScript must also be referenced. The code for both of these documents can be viewed below (Figures 3 and 4).

Figure 3: Part 2 Section 1 HTML code

Figure 4: Part 2 Section 1 JavaScript code

Section 2: Feature Service Creation and Development of a Web App for Eau Claire Schools

A feature service must be created from schools in Eau Claire and published to the UWEC ArcGIS Server REST. Also, add a predefined ESRI basemap and configure a pop up window for the service.

Copies must be made and renamed of the HTML and JavaScript files created in the previous section. A feature class containing the name, address, and elevation of the Eau Claire schools is created in ArcMap and saved to the UWEC enterprise geodatabase. Then it can be published to the server.

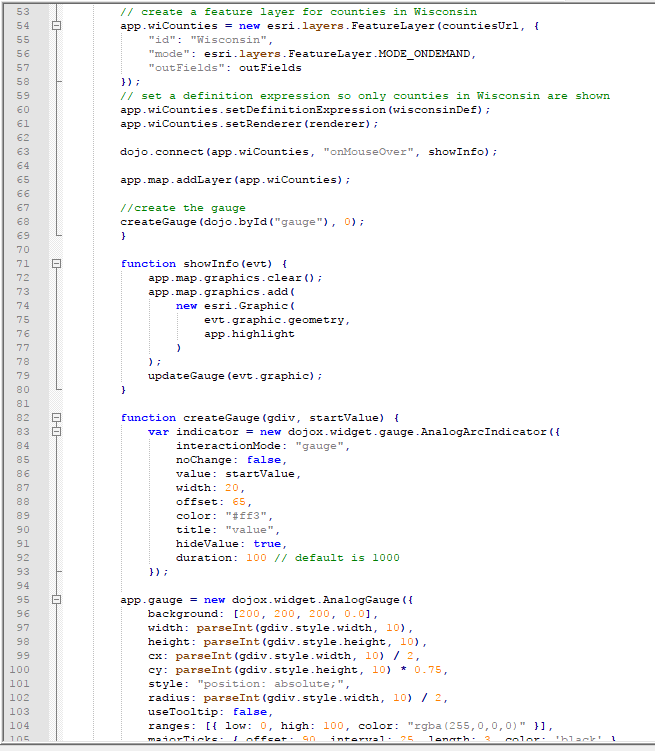
The copied and renamed JS file can now be edited with the following tasks:

     > Reposition the basemap to Eau Claire County using correct coordinates
     > Replace streets trees service with the EC_Schools feature service that was just published
     > Configure the popup so that the desired attributes in the popup info window is displayed when each school is clicked in the app

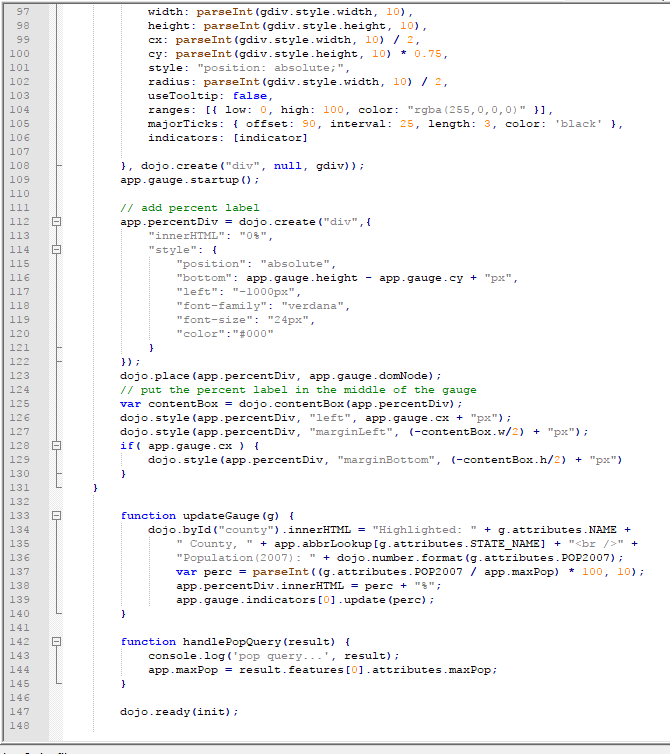
The JavaScript code for this section can be viewed below (Figure 5).

Figure 5: Part 2 Section 2 JavaScript code

Section 3: Fine Tune an Application Popup Window and Include a Scale Bar


A scale bar will be added to the map application and the popup window will be widened so that the text of each attribute is displayed on one line.

In the JavaScript file that was just created, the required dojo dijit module for a scalebar must be added. The function definition parameter that will call the scale bar must be included as well. A new Scalebar object with property values for 'map' and 'scalebarUnit' is added as well.

To change the size of the info window, the very last block of code is changed from 180, 75 to 250, 75.

Part 3: Develop a Simple Routing Application

A simple app is developed that finds routes between two or more points. The app will have the following features:

     > Click on the map to add stops to the route
     > When two stops are added, a route will be calculated
     > Adding subsequent stops on the map will extend the route

Using Notepad++, an HTML document is created and references are made to 'ESRI' and 'claro' external style sheets. The ArcGIS API for JavaScript is also referenced for access.

Using a new Notepad++ document, a JavaScript file is also written and connected to the Dojo library. A Dojo command is entered to access the modules for map, graphic, route task, and route parameters. Several other modules are also accessed. After this, JavaScript statements are written to declare variables, develop functions, and create objects. A new Map object is created with Eau Claire coordinates.

After all of the JavaScript code is written, the file can be saved and referenced in the HTML document that was just created. The code for both of these documents can be viewed below (Figures 6 and 7).

Figure 6: Part 3 HTML code

Figure 7: Part 3 JavaScript code

Results

Part 1: Basic Web GIS Mapping App

The resulting app from part 1 can be viewed below (Figure 8). It is a simple map that features a streets basemap and allows user to pan and zoom in and out.

Figure 8: Result from Part 1

Part 2: Web GIS App with Operational Layer Functionality

Section 1: Tree Species and Attributes in San Francisco

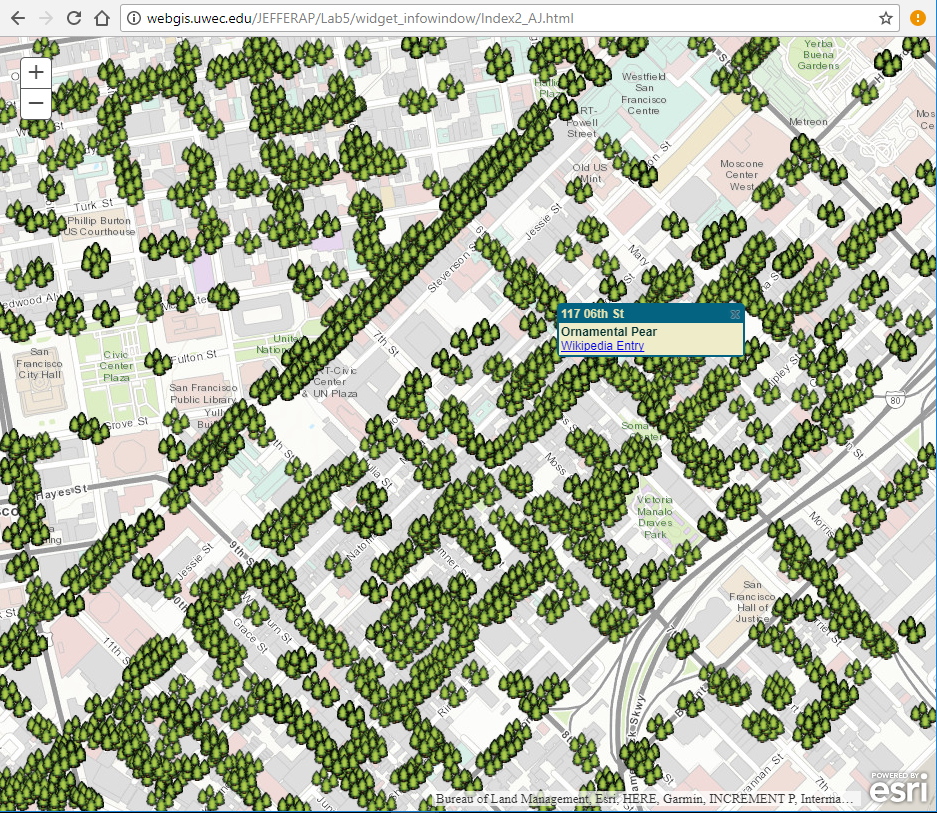
The resulting app from part 2 section 1 can be viewed below (Figure 9). The map features a streets basemap and displays trees located in San Francisco. When the map is initially launched, it is located directly over the city. Users can then pan and zoom in and out and click on any tree. The tree address and species is then displayed in a popup info window.

Figure 9: Result from Part 2 Section 1

Sections 2 & 3: Web App for Eau Claire Schools with Scale Bar

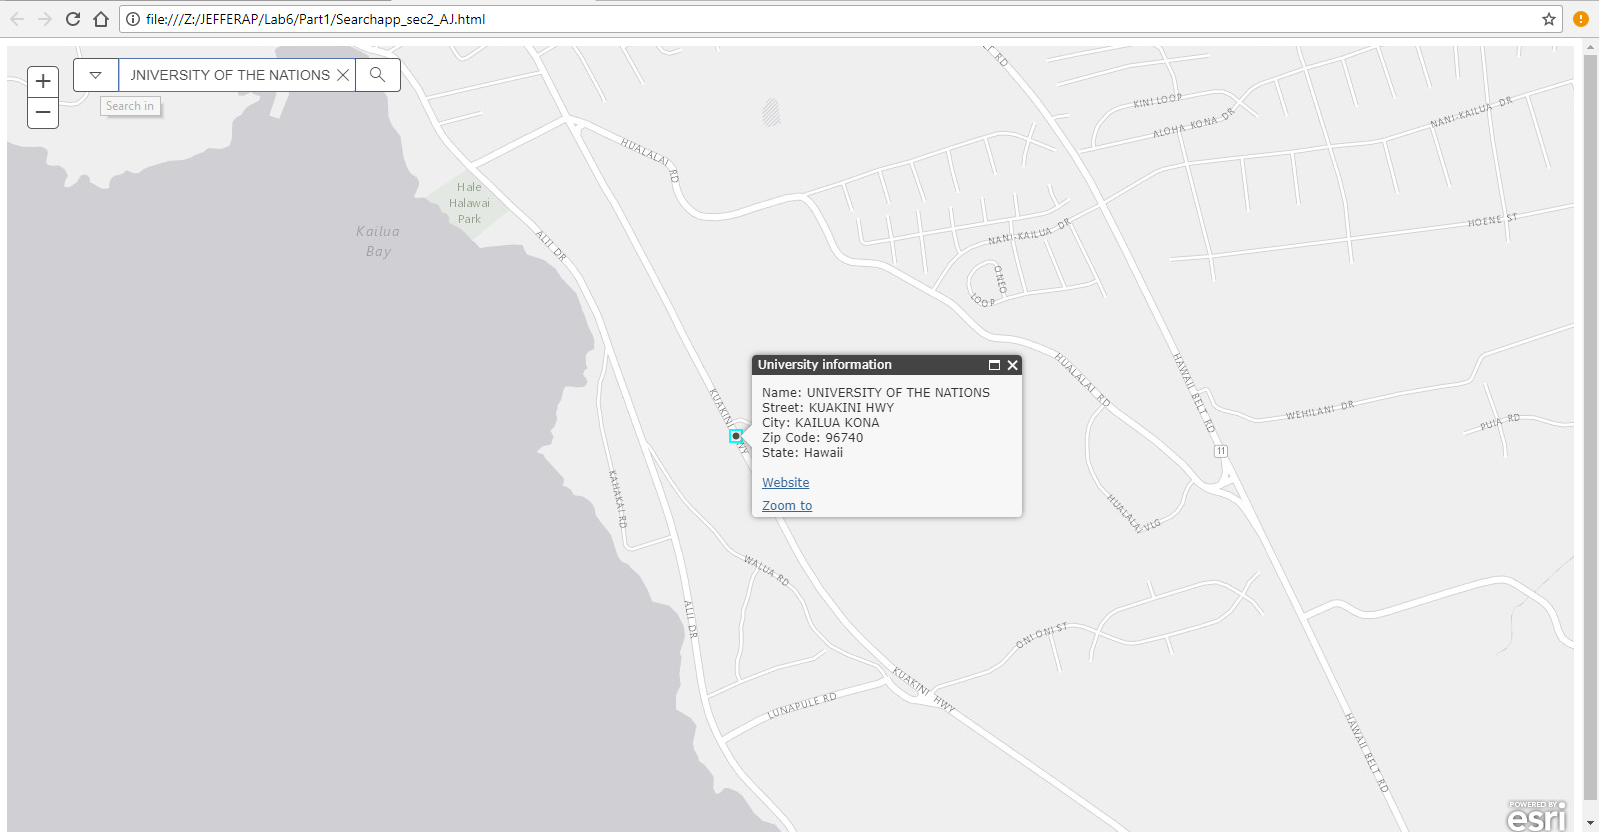
The result of part 2 sections 2 and 3 can be viewed below (Figure 10). The app features a streets basemap and displays school locations in Eau Claire. The map is located over Eau Claire when it is initially launched, and end users can pan and zoom and out of the map. When a school is clicked on, a popup info window is displayed that features the school name, address, and elevation. A dynamic scale bar is also featured in the lower left corner that has adjustable units based on the scale of the map.

Figure 10: Result from Part 2 Sections 2 and 3

Part 3: Simple Routing App

The result from part 3 can be viewed below (Figure 11). The map features a streets basemap that is located directly over Eau Claire when launched. End users can click on multiple destinations where routes are then automatically displayed between each selected location. Users can also zoom in and out and pan around the map.

Figure 11: Result from Part 3

Sources

ArcGIS API for JavaScript information:
ArcGIS API for JavaScript. (n.d.). Retrieved November 08, 2017, from https://developers.arcgis.com/javascript/3/

EC_Schools feature class:
MapCruzin [Advertisement]. (2012, October 1). Retrieved November 8, 2017, from http://www.mapcruzin.com/geographic-names-shapefiles/#School
Custom shapefiles and GIS projects, free GIS software, shapefiles, maps, and tutorials

EC_Schools_Address:
G. (2013). [Eau Claire School Addresses]. Unpublished raw data.
Table of Eau Claire, WI school addresses

Widget_infowindow files:
ArcGIS API for JavaScript 3.22. (n.d.). Retrieved November 08, 2017, from https://developers.arcgis.com/javascript/3/jssamples/